ANALYSIS OF A MIXTURE OF MINERALS - SIMULATION
Last Update 01/ 5/ 2018
in English/ in Esperanto/
in
Portuguese
Powder Method, X-ray Diffraction
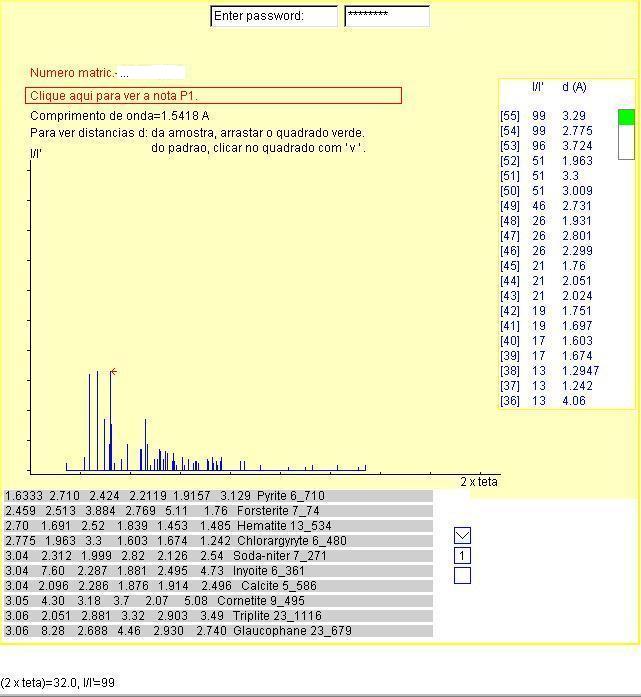
You are invited to use the Hanavalt1 method to identify
the sample components through the diffractogram on the figure, in blue.
A mouse move action over a diffractogram peak of the sample will show the
diffraction angle  in blue
and the relative intensity in this simulation I = peak height
and background I'=1.
in blue
and the relative intensity in this simulation I = peak height
and background I'=1.
Table-A shows the number of each diffracted ray in brackets in decreasing
order of relative intensity I/I' and the distance d in Angstrom
(1 A=10-10 m) between crystallographic planes "rich in atoms"2
on the sample3. A mouse drag action on the green square on table-A
will show other sections of the table. X-ray with wavelength equal to 1,5418
Angstrom4 was used in this simulation.
Table-B shows six distances d as defined above in decreasing
order of relative intensity I/I' for each standard5,
respectively on each line on page 1. If one of the 10 standards
in the page has d distances matching with the sample, a click on
the line will change the line color from gray to red and will display the
complete set of d distances of the selected standard on table-C
organized as in table-A and will also display the difractogram of the standard
in black. A mouse move action over a peak on the standard difractogram
will show the angle of the
diffracted ray and the relative intensity in black. Click on button V
to see next page of standards, until page 11. To return to the previous
page click on button with inverted V. If there is no standard matching
with the sample in one page it will be necessary to search in another page
on table-B.
A new access to this page Analysis of a Mixture of Minerals - Simulation
will present a sample with another different mixture of minerals.
The simulator on this page considers each standard as a pure material
in perfect crystals and each sample as a mixture of 2 pure standards each
one with perfect crystals. This explains why the diffractograms here simulated
have peaks as simple straight-line segments of one dimension, this does
not occur in mineral nature on planet Earth.
The figure below is just a screen print of
the simulator.
Exercises
1) Write the chemical formulas and names of the
minerals present in the sample, respectively.
2) What is the metal on the anode of a x-rays
source with wavelenght 1.5418 Angstrom?
3) What is the metal on the filter used for x-rays with wavelenght
1.5418 Angstrom?
4) What is the electron accelerating voltage in order to have x-rays
with wavelenght 1.5418 Angstrom?
References
1. HANAWALT, J. D,. Manual Search/Match Methods
for Powder Diffraction in 1986, Powder Diffraction, Vol 1, Issue 1, March
1986.
2. BRAGG, W.H.and BRAGG, W.L., The Reflection
of x-rays by crystals, Proc. R. Soc. Lond., A 88 (605), 428-38, 1913.
3. AZAROFF, L.V. and BUERGER, M.J., The Powder
Method in X-ray Christallography, McGraw-Hill, New York, 1958.
4. STOUT, G.H. and JENSEN, L.H., X-ray Structure
Determination, Macmillan, London, 1968.
5. BERRY, L.G.(Editor), Selected Powder Diffraction Data for Minerals,
Joint Commitee on Powder Difftraction Standards, Philadelphia, 1974
Theme table